In the dynamic world of React development, efficiency and clarity are everything.
React Developer Tools (React DevTools) helps the React developers to debug, analyze, and optimize their applications without trouble.This tool is primarily designed for React.js and works best for web applications.
Why React DevTools is a Must-Have
For business owners, finding and choosing the right e-commerce platform for business takes effort. You will need an expert who can understand your business vision and goal giving your customers a smooth experience. We have some of the best platforms to choose from. Let’s read and decide which is better and capable of helping your business scalability.
Getting Started with React DevTools
Installing React DevTools is effortless:
- Chrome: Add it using the Chrome Web Store.
- Firefox: Install it from the Firefox Add-ons.
- Safari: Download it from the Safari Extensions Gallery or install through the React DevTools GitHub page for a manual installation.
- Edge: Get it from the Microsoft Edge Add-ons store.
Main Features of React DevTools
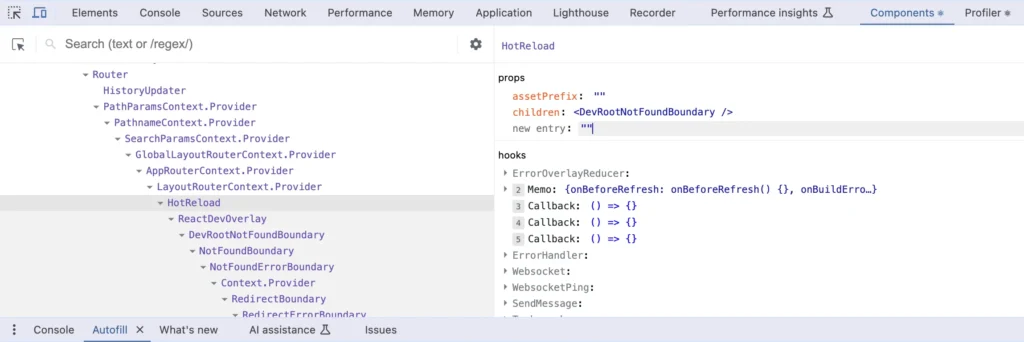
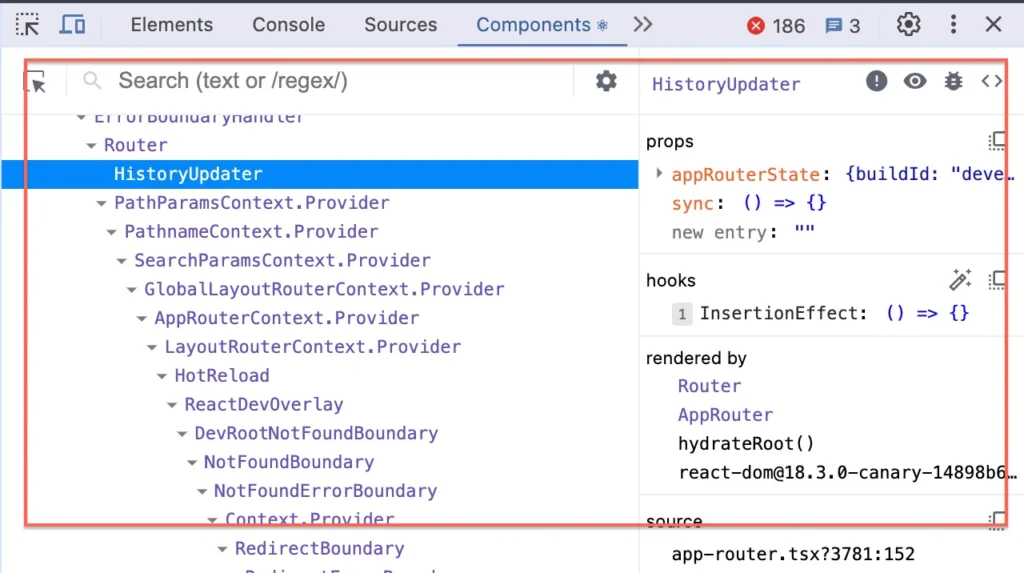
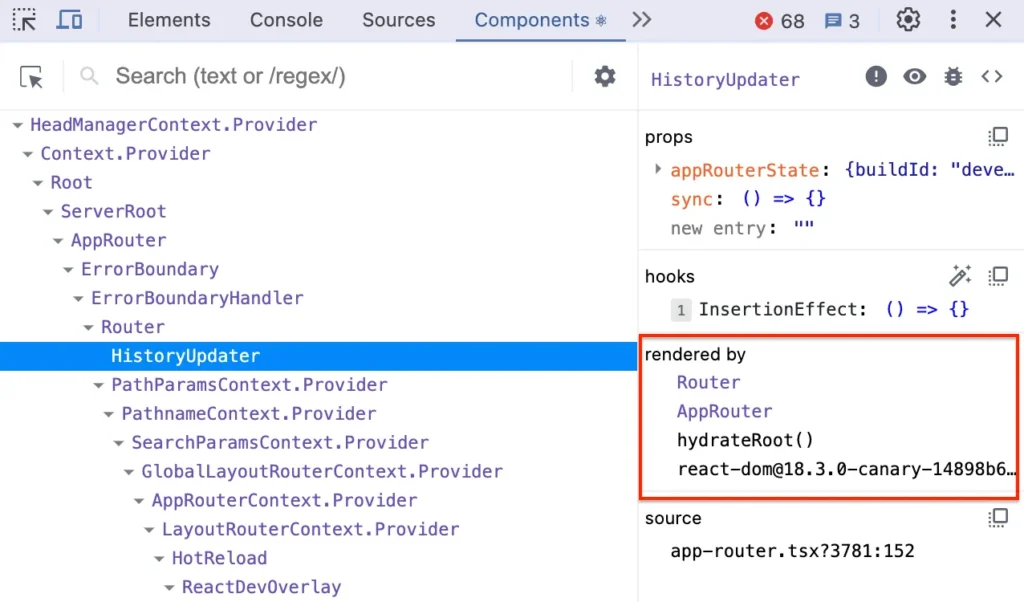
1. Component Tree Exploration
2. Props and State Insights
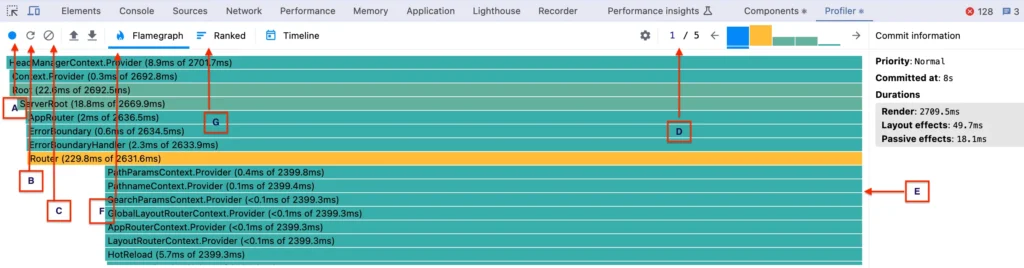
- A is the record button, which allows you to record a profiling session.
- B is the refresh button, which will help you refresh the page for a session.
- C is the clear button, which will guide you clear the profiling session’s result.
- D is the commit chart, which will show you the list of commits during a session.
- E is the component list, which will show you the components rendered during a session.
- F is the flame chart button, which will show you the component list like E.
- G is the ranked chart button, which will show you the component list in a ranked manner.
3. Interactive Highlighting
4. Hook Inspection
5. Performance Profiler
Optimize your app with the Profiler tool:
- Record rendering performance.
- Identify inefficient components.
- Execute strategies like React.memo or useCallback to organize renders.
How to Use the Profiler Tab
6. Component Search
How to Track the Performance of Your Web Page
To check the performance of your web page, all you need to do is:
- Click on the record button.
- Use your web page so that the Profiler will be able to analyse the rendering of components.
- Click the record button again to finish recording.
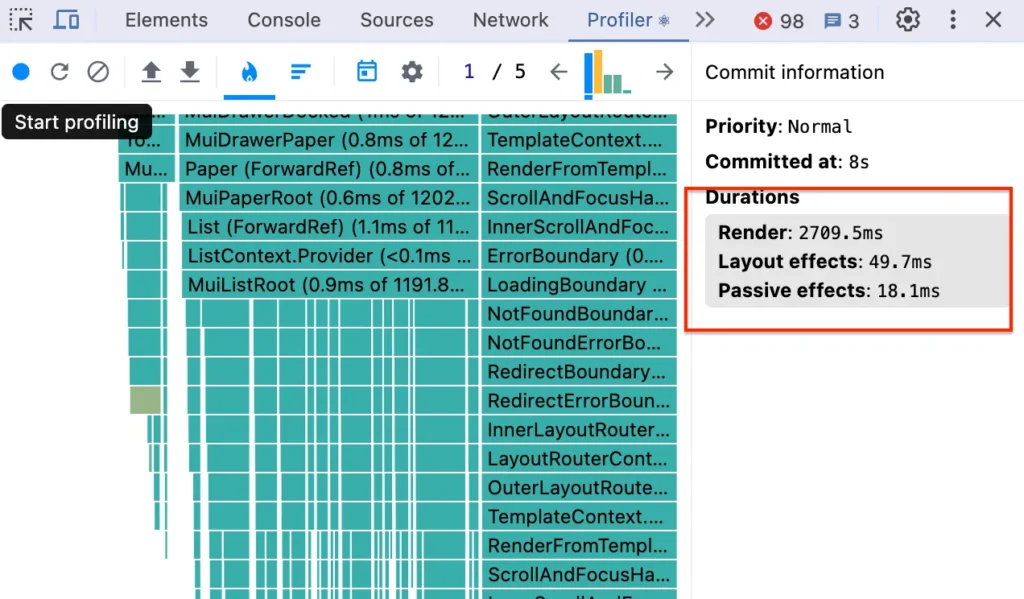
Then you will see the flame chart, and you can analyse which components are taking longer than expected to render.
Note that the flame chart also shows:
- When exactly the component is rendered.
- And how long it took to render in a profiling session.
For example: In below image, the Home component was rendered at 1.5s of the profiling session and it took 27.7 ms to render.
7. Error Alerts
Pro Tips for Debugging with React DevTools
Debugging Props and State
When a component misbehaves:
- Open React DevTools and select the component.
- Identify the props and check their correctness.
- Inspect state to make sure it updates as expected.
Handling Re-Rendering Issues
- Use the Profiler to record interactions.
- Find components with unexpected renders.
- Optimize performance with techniques like memoization or splitting renders.
Maximize Your Efficiency
- Keyboard Shortcuts: Navigate like a pro using arrow keys and shortcuts.
- Context API Debugging: Inspect and validate Context values seamlessly.
- Theme Customization: Toggle between light and dark themes for ideal readability.
- Standalone DevTools: Debug React Native or remote apps smoothly with the standalone app.
- Keep Updated: Make sure your DevTools version matches your React version for peak compatibility.